Air defence missiles
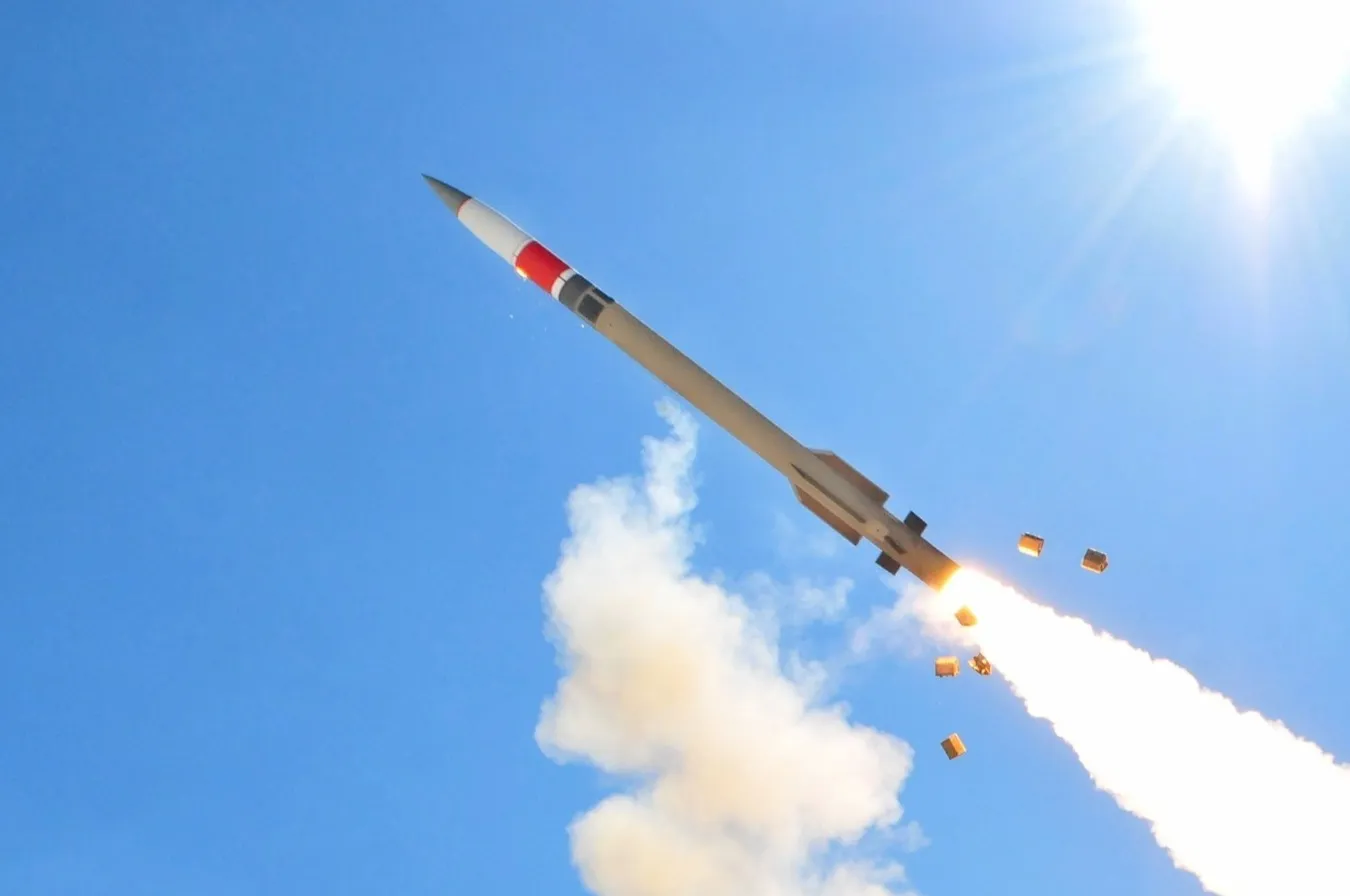
PAC-3 MSE
- at least 51.7 missiles / mo
- 48.6 missiles / mo
- Producing countries
- 1
- Last figure
- Updated Apr 2026
This is what the ledger can account for. Where no figure has been published for a producing country, only the plants and producers a source has named are counted, so the real total is higher.
Some lines report in other units and are not included in the totals.
: 2,000 missiles per year by Jan 2033
Production by scope
Each country the item is made in, broken down into the producers and plants a source has named. A plant’s figure is part of its country’s, never added to it.
| Scope | Producer | Output / mo | Capacity / mo | Updated | Evidence and chart |
|---|---|---|---|---|---|
 United States United States | at least51.7 | 48.6 | Updated Apr 2026 | ||
| Lockheed Martin | Lockheed Martin | at least51.7 | 48.6 | Updated Apr 2026 | |
| Camden Operations | Lockheed Martin | — | — | Stale · Dec 2023 |
History
Every published figure for one line. The band is the range a source gave; hollow points are estimates; dashed is a target or forecast; grey points were corrected later.
The figures in this chart
| Date | Value | Range | Basis |
|---|---|---|---|
| 31 Dec 2024 | 41.7 | — | Target |
| 31 Dec 2024 | 41.7 | — | Official |
Promises vs delivery
Each announced target or forecast, next to what was reported once its date arrived.
Capacity target · United States · Lockheed Martin
2,000 missiles per year by Jan 2033
B2 Lockheed Martin Lockheed Martin and Department of War Advance Landmark Acquisition Transformation to Accelerate PAC-3® MSE Production 6 Jan 2026PendingLatest figure so far
48.6 missiles per month Jan 2025
Capacity target · United States · Lockheed Martin
650 missiles per year by Dec 2027
PendingLatest figure so far
48.6 missiles per month Jan 2025
Output target · United States · Lockheed Martin
500 missiles per year by Dec 2024
B2 Lockheed Martin Lockheed Martin Accelerates Production to Meet Strong Demand, Delivers 1000th PAC-3 MSE 17 Nov 2021MetFirst figure on or after the date
≥ 500 missiles per year Dec 2024
Figures and evidence
Every published figure that stands, with the sentence each one rests on. A figure is never edited: a correction is a new figure, and the old one is kept below.
United States at least 51.7
missiles / mo 14
figures
Lockheed Martin
2,000 missiles per year
by Jan 2033
Capacity target Official high“Approximately”; the capacity goal of a seven-year framework agreement between Lockheed Martin and the U.S. Department of War.
- B2 Lockheed Martin Lockheed Martin and Department of War Advance Landmark Acquisition Transformation to Accelerate PAC-3® MSE Production 6 Jan 2026Quote checked against the document
-
650 missiles per year
by 2027
Capacity target Official highAnnual rate Lockheed Martin is “expected to reach” by 2027 under a U.S. Army contract to increase production capacity.
- Quote checked against the document
-
650 missiles per year
2026–2027
Capacity forecast · single shift Official highAnnual capacity on a single shift, for U.S. fiscal year 2027, in the Army’s FY 2027 budget justification.
- A2 Department of the Army, Assistant Secretary of the Army (Financial Management and Comptroller) Department of War Fiscal Year (FY) 2027 Budget Estimates: Missile Procurement, Army (Justification Book, Volume 1) p. 74 1 Apr 2026Quote checked against the document
-
2,000 missiles per year
2026–2027
Capacity forecast · maximum Official highMaximum annual rate for U.S. fiscal year 2027, in the Army’s FY 2027 budget justification.
- A2 Department of the Army, Assistant Secretary of the Army (Financial Management and Comptroller) Department of War Fiscal Year (FY) 2027 Budget Estimates: Missile Procurement, Army (Justification Book, Volume 1) p. 74 1 Apr 2026Quote checked against the document
-
550 missiles per year
2024–2025
Capacity forecast · single shift Official highAnnual capacity on a single shift, for U.S. fiscal year 2025, as the Army stated it.
- A2 Department of the Army, Assistant Secretary of the Army (Financial Management and Comptroller) Department of Defense Fiscal Year (FY) 2025 Budget Estimates: Missile Procurement, Army (Justification Book) p. 54 1 Mar 2024Quote checked against the document
-
550 missiles per year
2024–2025
Capacity forecast · maximum Official highAnnual capacity at the maximum rate, for U.S. fiscal year 2025, as the Army stated it.
- A2 Department of the Army, Assistant Secretary of the Army (Financial Management and Comptroller) Department of Defense Fiscal Year (FY) 2025 Budget Estimates: Missile Procurement, Army (Justification Book) p. 54 1 Mar 2024Quote checked against the document
-
48.6 missiles per month
stated 10 Jan 2025
Capacity Official highCurrent U.S. rate, as stated by the Department of Defense; the fractional monthly rate is as written.
- B2 U.S. Department of Defense Fact Sheet on Efforts of Ukraine Defense Contact Group – National Armaments Directors 10 Jan 2025Quote checked against the document
-
≥ 500 missiles per year
2024
Output Official high“More than 500”, a lower bound; PAC-3 MSEs “produced and delivered” in 2024, a record year, as stated by Lockheed Martin.
- Quote checked against the document
-
500 missiles per year
by 2024
Output target Official highAnnual production Lockheed Martin expected to reach by 2024, as it stated.
- B2 Lockheed Martin Lockheed Martin Accelerates Production to Meet Strong Demand, Delivers 1000th PAC-3 MSE 17 Nov 2021Quote checked against the document
-
42 missiles per month
stated 6 Sep 2024
Capacity Reported high- B2 U.S. Department of Defense Fact Sheet on Efforts of Ukraine Defense Contact Group – National Armaments Directors 6 Sep 2024Quote checked against the document
-
550 missiles per year
from Q4 2024
Capacity target Official highAnnual production rate from the fourth quarter of 2024, under a contract to raise it.
- A2 U.S. Department of Defense (Executive Services Directorate reading room) Modernized Selected Acquisition Report (MSAR): Patriot Advanced Capability-3 Missile Segment Enhancement (PAC-3 MSE), December 31, 2023 p. 7 31 Dec 2023Quote checked against the document
-
500 missiles per year
stated 31 Dec 2023
Capacity Official highThe PAC-3 MSE production rate before a contract to raise it.
- A2 U.S. Department of Defense (Executive Services Directorate reading room) Modernized Selected Acquisition Report (MSAR): Patriot Advanced Capability-3 Missile Segment Enhancement (PAC-3 MSE), December 31, 2023 p. 7 31 Dec 2023Quote checked against the document
-
21 missiles per month
2022
Capacity Reported high- B2 U.S. Department of Defense Fact Sheet on Efforts of Ukraine Defense Contact Group – National Armaments Directors 6 Sep 2024Quote checked against the document
-
Camden Operations Lockheed Martin
1,000 missiles total
by 18 Oct 2021
Output Official highThe 1,000th PAC-3 MSE completed at Lockheed Martin’s Camden, Arkansas, facility since production began.
- A2 U.S. Department of Defense (Executive Services Directorate reading room) Modernized Selected Acquisition Report (MSAR): Patriot Advanced Capability-3 Missile Segment Enhancement (PAC-3 MSE), December 31, 2023 p. 7 31 Dec 2023Quote checked against the document
-
Across the item
244 missiles total
2026–2027
Order target ordered by United States Official highU.S. Army procurement quantity for U.S. fiscal year 2027, discretionary funding, as requested.
- A2 Department of the Army, Assistant Secretary of the Army (Financial Management and Comptroller) Department of War Fiscal Year (FY) 2027 Budget Estimates: Missile Procurement, Army (Justification Book, Volume 1) p. 64 1 Apr 2026Quote checked against the document
-
2,554 missiles total
2026–2027
Order target ordered by United States Official highU.S. fiscal year 2027 request from mandatory funding, on top of the base request.
- A2 Department of the Army, Assistant Secretary of the Army (Financial Management and Comptroller) Department of War Fiscal Year (FY) 2027 Budget Estimates: Missile Procurement, Army (Justification Book, Volume 1) p. 66 1 Apr 2026Quote checked against the document
-
310 missiles total
2025–2026
Order ordered by United States Official highU.S. Army procurement quantity for U.S. fiscal year 2026 (discretionary); other exhibits in the same book give a slightly different figure.
- A2 Department of the Army, Assistant Secretary of the Army (Financial Management and Comptroller) Department of War Fiscal Year (FY) 2027 Budget Estimates: Missile Procurement, Army (Justification Book, Volume 1) p. 64 1 Apr 2026Quote checked against the document
-
48 missiles total
2025–2026
Order ordered by United States Official highBought with mandatory funding received in U.S. fiscal year 2026, on top of the discretionary quantity.
- A2 Department of the Army, Assistant Secretary of the Army (Financial Management and Comptroller) Department of War Fiscal Year (FY) 2027 Budget Estimates: Missile Procurement, Army (Justification Book, Volume 1) p. 66 1 Apr 2026Quote checked against the document
-
1,764 missiles total
stated Apr 2026
Delivery to United States Official highDelivered to the U.S. Army to date from its earlier procurement lots, as listed in the Army’s FY 2027 budget justification; excludes foreign sales.
- A2 Department of the Army, Assistant Secretary of the Army (Financial Management and Comptroller) Department of War Fiscal Year (FY) 2027 Budget Estimates: Missile Procurement, Army (Justification Book, Volume 1) p. 70 1 Apr 2026Quote checked against the document
-
620 missiles per year
2025
Delivery from United States · recipient not named Official highDelivered by Lockheed Martin in 2025, as stated in its release; the recipients are not named.
- B2 Lockheed Martin Lockheed Martin and Department of War Advance Landmark Acquisition Transformation to Accelerate PAC-3® MSE Production 6 Jan 2026Quote checked against the document
-
194 missiles total
2024–2025
Order ordered by United States Official highU.S. Army procurement quantity for U.S. fiscal year 2025, as enacted.
- A2 Department of the Army, Assistant Secretary of the Army (Financial Management and Comptroller) Department of War Fiscal Year (FY) 2027 Budget Estimates: Missile Procurement, Army (Justification Book, Volume 1) p. 64 1 Apr 2026Quote checked against the document
-
92 missiles total
stated Mar 2024
Delivery to United States Official highDelivered to the U.S. Army from its earliest procurement lots, as listed in the Army’s budget justification; excludes foreign sales.
- A2 Department of the Army, Assistant Secretary of the Army (Financial Management and Comptroller) Department of Defense Fiscal Year (FY) 2025 Budget Estimates: Missile Procurement, Army (Justification Book) p. 48 1 Mar 2024Quote checked against the document
-
1,134 missiles total
by 31 Dec 2023
Delivery to United States Official highPAC-3 MSE delivered to the U.S. programme to date, in the Selected Acquisition Report; excludes foreign sales.
- A2 U.S. Department of Defense (Executive Services Directorate reading room) Modernized Selected Acquisition Report (MSAR): Patriot Advanced Capability-3 Missile Segment Enhancement (PAC-3 MSE), December 31, 2023 p. 26 31 Dec 2023Quote checked against the document
-
1,042 missiles total
by 13 Dec 2022
Delivery to United States Official highPAC-3 MSE delivered to the U.S. programme to date, as of 13 December 2022, in the Selected Acquisition Report; excludes foreign sales.
- A2 U.S. Department of Defense (Executive Services Directorate reading room) Selected Acquisition Report (SAR): Patriot Advanced Capability-3 Missile Segment Enhancement (PAC-3 MSE), SAR DEC 2022 p. 30 1 Dec 2022Quote checked against the document
-
Sources
Every document behind the figures on this page.
- A Department of the Army, Assistant Secretary of the Army (Financial Management and Comptroller) Department of War Fiscal Year (FY) 2027 Budget Estimates: Missile Procurement, Army (Justification Book, Volume 1) 1 Apr 2026
- B U.S. Department of Defense Fact Sheet on Efforts of Ukraine Defense Contact Group – National Armaments Directors 10 Jan 2025
- B U.S. Department of Defense Fact Sheet on Efforts of Ukraine Defense Contact Group – National Armaments Directors 6 Sep 2024
- A Department of the Army, Assistant Secretary of the Army (Financial Management and Comptroller) Department of Defense Fiscal Year (FY) 2025 Budget Estimates: Missile Procurement, Army (Justification Book) 1 Mar 2024
- A U.S. Department of Defense (Executive Services Directorate reading room) Modernized Selected Acquisition Report (MSAR): Patriot Advanced Capability-3 Missile Segment Enhancement (PAC-3 MSE), December 31, 2023 31 Dec 2023
- A U.S. Department of Defense (Executive Services Directorate reading room) Selected Acquisition Report (SAR): Patriot Advanced Capability-3 Missile Segment Enhancement (PAC-3 MSE), SAR DEC 2022 1 Dec 2022
- B Lockheed Martin Lockheed Martin Accelerates Production to Meet Strong Demand, Delivers 1000th PAC-3 MSE 17 Nov 2021
Facilities
-
Camden Operations
United States · Lockheed Martin
operating
B2 means a usually reliable source making a statement that is probably true.