Cruise missiles
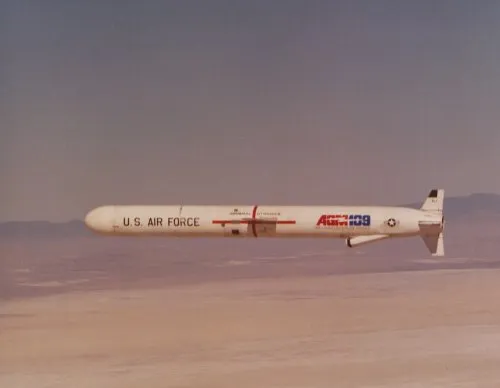
BGM-109 Tomahawk
- —
- —
- Producing countries
- —
- Last figure
- Updated 4 Feb 2026
This is what the ledger can account for. Where no figure has been published for a producing country, only the plants and producers a source has named are counted, so the real total is higher.
: ≥ 1,000 missiles per year by Feb 2033
Production by scope
Each country the item is made in, broken down into the producers and plants a source has named. A plant’s figure is part of its country’s, never added to it.
| Scope | Producer | Output / mo | Capacity / mo | Updated | Evidence and chart |
|---|---|---|---|---|---|
 United States United States | — | — | Updated 4 Feb 2026 | ||
| Raytheon | Raytheon | — | — | Updated 4 Feb 2026 |
History
Every published figure for one line. The band is the range a source gave; hollow points are estimates; dashed is a target or forecast; grey points were corrected later.
The figures in this chart
| Date | Value | Range | Basis |
|---|---|---|---|
| 28 Feb 2033 | 83.3 | — | Target |
Promises vs delivery
Each announced target or forecast, next to what was reported once its date arrived.
Output target · United States · Raytheon
≥ 1,000 missiles per year by Feb 2033
PendingNo comparable figure published yet
Figures and evidence
Every published figure that stands, with the sentence each one rests on. A figure is never edited: a correction is a new figure, and the old one is kept below.
United States 1
figure
Raytheon
≥ 1,000 missiles per year
by Feb 2033
Output target Official high“More than”, a lower bound; RTX's goal for annual production under framework agreements with the U.S. Department of War.
- B2 RTX RTX's Raytheon partners with Department of War on five landmark agreements to expand critical munition production 4 Feb 2026Quote checked against the document
-
Across the item
34 missiles total
2023–2024
Order target ordered by United States Reported highProcurement quantity for U.S. fiscal year 2024, as requested in the FY 2024 President’s Budget. Marine Corps only; the Navy line has no quantity.
- A2 Office of the Under Secretary of Defense (Comptroller)/Chief Financial Officer Program Acquisition Cost by Weapon System: United States Department of Defense Fiscal Year 2024 Budget Request p. 86 1 Mar 2023Quote checked against the document
-
68 missiles total
2022–2023
Order ordered by United States Reported highProcurement quantity for U.S. fiscal year 2023, as enacted. Navy and Marine Corps.
- A2 Office of the Under Secretary of Defense (Comptroller)/Chief Financial Officer Program Acquisition Cost by Weapon System: United States Department of Defense Fiscal Year 2024 Budget Request p. 86 1 Mar 2023Quote checked against the document
-
Sources
Every document behind the figures on this page.
- A Office of the Under Secretary of Defense (Comptroller)/Chief Financial Officer Program Acquisition Cost by Weapon System: United States Department of Defense Fiscal Year 2024 Budget Request 1 Mar 2023
B2 means a usually reliable source making a statement that is probably true.